

The sanitation vehicle market is one of the few equipment segments where demand is driven by a number nobody can argue with: the amount of waste a city has to collect. That number is rising, while the trucks that collect it are ageing and, in many cities, facing emission rules they cannot meet.
This analysis looks at what is driving municipal fleet renewal, how cities structure a mixed sanitation order, what changes when a fleet moves to electric traction, and how Chinese manufacturers fit into the supply picture. For the ordering process, see our sanitation vehicle export and fleet buying guide.
Market Snapshot: Waste Is Growing Faster Than Fleets
Global municipal solid waste generation was measured at about 2.01 billion tonnes in 2016. Under current trends, the World Bank projects that figure to reach 3.4 billion tonnes by 2050 - an increase of roughly 70 percent in three decades.
The distribution of that growth matters more than the total, because it tells you where fleets have to be created rather than replaced.
| Region | 2016 (Mt/yr) | 2050 (Mt/yr) | Change |
|---|---|---|---|
| Sub-Saharan Africa | 174 | 516 | ≈ 3.0× |
| South Asia | 334 | 661 | ≈ 2.0× |
| Middle East and North Africa | 129 | 255 | ≈ 2.0× |
| Latin America and Caribbean | 231 | 369 | ≈ 1.6× |
| Europe and Central Asia | 392 | 490 | ≈ 1.25× |
| East Asia and Pacific | 468 | 714 | ≈ 1.5× |
| North America | 289 | 396 | ≈ 1.4× |
Source: World Bank, What a Waste 2.0 - A Global Snapshot of Solid Waste Management to 2050.
Read the table as a purchasing signal. In Sub-Saharan Africa and South Asia, waste volumes are doubling or tripling on a base where collection coverage is still incomplete - that combination requires more vehicles, not better ones. In Europe and North America, volumes are close to flat and the requirement is replacement plus compliance, which is a different product mix and a different sales conversation.
Driver 1: The Collection Coverage Gap
Coverage is the first constraint. In low-income countries, collection reaches roughly half of urban waste and about a quarter of rural waste; more than 90 percent of waste in those markets is either openly dumped or burned.
Closing that gap is a fleet-sizing exercise before it is anything else. A city that moves from 50 percent to 80 percent collection coverage needs roughly 60 percent more collection capacity - either more vehicles, more trips per vehicle, or both. Since trips per vehicle are capped by tipping point distance and shift length, most of the requirement lands on vehicle count.
This is why the growth markets buy standardised, robust collection bodies on proven light and medium chassis rather than high-technology units. What matters is availability: a truck that is in the workshop cannot collect.
Driver 2: Fleet Age and Emission Rules
Where coverage is already near universal, renewal is driven by age and regulation. Sanitation vehicles work short, stop-start duty cycles with continuous hydraulic load on the compactor or sweeper - a duty cycle that wears a chassis far faster than highway mileage suggests.
Practical fleet life in municipal service is commonly planned at eight to ten years. Add tightening emission standards in the importing market - national engine emission stages, urban low-emission zones, age-based entry bans - and a large cohort of vehicles becomes non-compliant at the same time.
The result is a lumpy order pattern: several years of modest purchasing followed by a replacement wave. Suppliers who can hold a production slot through such a wave have an advantage, and buyers who start the specification process early avoid paying a premium for urgency.
Driver 3: Cost per Tonne Pressure
Solid waste management consumes a large share of municipal budgets - on the order of 20 percent in low-income countries - while the cost per tonne handled varies enormously between markets. Developing economies typically spend around 35 US dollars per tonne; high-income economies spend more than 100.
That gap is not a target to close by buying cheaper trucks. It is the reason procurement logic differs by market:
• Cost per tonne is dominated by labour, fuel and route design, with the vehicle as one input. Buyers under budget pressure therefore optimise body volume per chassis and fuel consumption per shift before they optimise specification level.
• Downtime is the hidden cost. Spare parts availability and local service capability have a larger effect on cost per tonne than a marginal difference in purchase price.
• Standardisation pays twice - once in purchase price through volume, and again over the life of the fleet through shared parts and training.
What Cities Actually Order
Sanitation is not a single vehicle category. A functioning municipal fleet is a mix, and the mix is fairly predictable in proportion.
| Vehicle type | Typical share of a new fleet order | Key specification |
|---|---|---|
| Refuse collection / compactor | 55–70% | Body volume 6–18 m³; compaction ratio; bin-lift type |
| Road sweeper | 10–20% | Sweeping width 2.5–3.5 m; water tank; suction capacity |
| Water tanker / sprinkler | 10–15% | Tank 5–15 m³; pump flow; spray bar width |
| Vacuum / sewer cleaning | 5–10% | Vacuum and jetting pressure; tank split |
| Skip loader / hook lift | 5–15% | Lift capacity; container standard |
Two specification details decide whether an order is actually usable. The first is bin-lift compatibility: a compactor that cannot pick up the bins the city already owns is a stranded asset. The second is body volume against street width - a 18 m³ body on a narrow-chassis truck cannot service old-town streets, and many cities therefore split their order between larger units for arterial routes and compact units for dense areas.
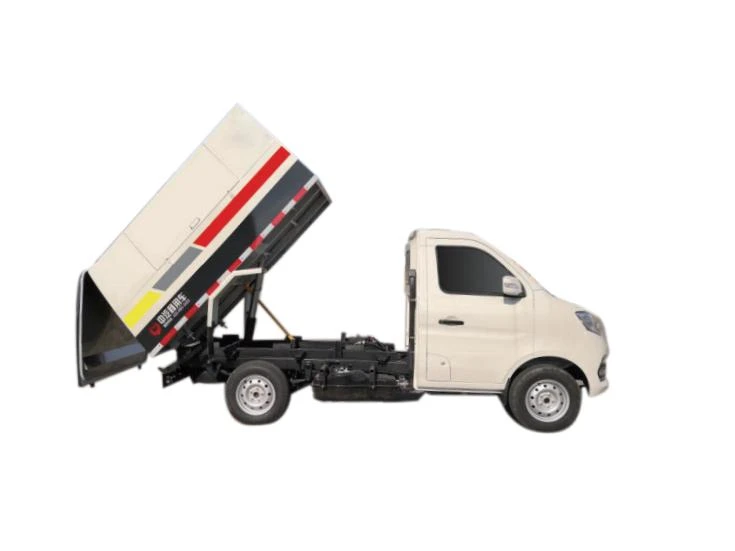
The collection workhorse we export most often is the refuse collection vehicle, built on light and medium chassis that suit narrow urban streets; the full range is listed under sanitation vehicles.
Chassis Standardization as a Procurement Strategy
The most common purchasing mistake in municipal fleets is diversification by accident: three body types on four different chassis, each with its own filters, brake parts and diagnostic tooling. The fleet then carries four spare-parts inventories and trains mechanics four times.
A deliberate strategy runs the other way. Choose one chassis family, then specify bodies on it - a light chassis for collection in dense areas, a medium chassis for sweepers and tankers, and a heavy chassis only where payload genuinely requires it. The benefits compound:
• One parts inventory, one diagnostic tool set, one training syllabus.
• Higher mechanic competence per platform, because they work on the same base vehicle daily.
• Mixed-fleet shipping in one consignment, which reduces freight per unit compared with shipping vehicle classes separately.
Chassis families commonly used for export sanitation bodies include light-duty ranges for collection in narrow streets and medium-duty ranges for sweepers and tankers - see the light cargo truck range and the heavy-duty cargo truck range for chassis bases.
Electrification: Where It Works and Where It Does Not
Electric sanitation vehicles are a genuine trend, but the adoption pattern is narrower than the marketing suggests, and buyers should understand the boundary.
Where it works: fixed daily routes within a defined radius, depot charging overnight, low average speed with frequent stops, and a municipal sustainability mandate that values the visible outcome. Refuse collection is close to an ideal duty cycle for electrification on paper, because stop-start operation regenerates energy and depot return is predictable.
Where it does not yet work: long rural collection routes, markets without reliable depot power, and weight-sensitive operations where battery mass reduces payload. In those settings a diesel unit on a proven chassis remains the lower-risk purchase, and the total cost of ownership case for electric does not close.
The practical middle path many cities take is a pilot: a small number of electric units on the most predictable route, keeping the rest of the fleet conventional until charging and maintenance experience is established. That approach also gives the supplier a real operating data set to design the second order against.
Regional Demand Map
| Region | Demand driver | Product emphasis |
|---|---|---|
| Sub-Saharan Africa | Coverage expansion; waste volume tripling | Robust compactors on light chassis; simple hydraulics |
| South Asia | Urbanisation; collection coverage gap | High-volume collection bodies; sweeper introduction |
| Middle East and North Africa | Urban growth; heat and dust duty | Upgraded cooling; sealed electrics; water tankers |
| Southeast Asia | Dense cities; narrow street access | Compact collection units; small sweepers |
| Latin America | Fleet renewal; private concessionaires | Standardised fleets under service contracts |
| Europe and Central Asia | Replacement; emission compliance | Euro-stage engines; electric pilots |
Outlook for 2026-2030
Three expectations for the coming five years:
• Volume growth concentrated in Africa and South Asia, where waste generation is rising fastest and coverage is lowest. This is the largest sustained addition to global sanitation fleet capacity.
• Renewal-driven demand in mature markets, shaped by emission rules and by the age of vehicles bought during the last replacement wave.
• Electrification as an overlay, not a replacement. Electric units will take the predictable urban routes; conventional units will keep the long and heavy-duty work for some years yet.
For a city or a contractor assembling a first fleet order, the sequence that reliably works is: map the routes, size the bodies to the streets, standardise the chassis, then negotiate. A mixed order placed on a standardised chassis base is easier to maintain, cheaper to ship and simpler to expand. Our fleet buying guide sets out that sequence step by step.
Frequently Asked Questions
1. How is the sanitation vehicle market growing?
In line with waste generation, which the World Bank projects to rise about 70 percent between 2016 and 2050, from 2.01 to 3.4 billion tonnes per year. Growth is concentrated in Sub-Saharan Africa, where volumes are expected to roughly triple, and South Asia, where they roughly double.
2. What is the most common first order for a city?
A refuse collection fleet: compactors of two sizes for arterial and dense-street routes, usually on one chassis family, followed by sweepers and water tankers in the next procurement cycle.
3. Should we buy electric sanitation vehicles now?
On predictable urban routes with depot charging, yes, as a pilot. On long rural routes, in markets without reliable depot power, or where payload is already tight, conventional units remain the lower-risk choice.
4. How important is bin-lift compatibility?
Critical. The collection body must lift the bins the city already owns. Retrofitting a lift mechanism after delivery is expensive and often compromises the body structure.
5. Can different vehicle types ship together?
Yes, and mixing them in one consignment reduces freight per unit. Standardising the chassis family also simplifies loading and reduces the spare-parts inventory you need to stock at destination.
6. What is a realistic delivery time for a fleet order?
Body building on available chassis typically runs 35 to 60 days per batch, with staggered delivery possible across several shipments. Fleet orders with custom body volumes should add engineering time before production starts.
Request a Custom Quote
Hong Kong Dragon Fist Trade Services Limited supplies complete sanitation fleets - refuse collection vehicles, road sweepers, water tankers and vacuum trucks - to municipalities, waste management contractors and fleet operators, specified around routes and bins rather than around a catalogue.
Send us your route profile, bin standard and the vehicle mix you need, and we will return a fleet configuration with quotation and shipping plan. Browse the sanitation vehicle range, or contact us to start the configuration.
Related Import Guides
Sanitation Vehicle Export from China: Garbage Trucks, Sweepers and Water Trucks (Fleet Buying Guide)
Bridge Inspection Truck Market Outlook: Why Aging Bridges Are Driving Demand
Emergency Bridge Vehicle Market: Disaster Frequency, Pre-Positioning and Procurement Trends
Bridge Inspection Truck Export from China: Underbridge Platform Specs and Custom Order Guide
Refrigerated Truck Export from China: Custom-Order, Inspect and Ship Guide
How to Import Cars from China to the UAE: Process, Costs and Customs